
Twelve month analysis of temperature, precipitation, wind, and daylight cycles
Sławice Duchowne Monthly Climate Normals, Representative 1991 to 2020 Atmospheric Averages
Detailed monthly climate profiles for Sławice Duchowne in Lesser Poland Voivodeship illustrate long term atmospheric patterns based on NASA POWER measurements. This dataset provides standardized averages for temperature, precipitation, relative humidity, wind speed, and daylight duration from 1991 through 2020. These metrics represent climatological conditions at a specific central coordinate rather than real time weather or localized terrain variation.
Long-term thermal variation and average daily precipitation across all twelve months at a representative coordinate.
Sławice Duchowne Annual Climate Normals, Monthly Average Temperatures, and Precipitation Rates
- Annual mean
- 7.9 °C
- Warmest month
- July
- Coolest month
- January
- Wettest month
- July
Compare average temperature bounds, precipitation rates, wind speed, humidity, and daylight across the annual cycle
Sławice Duchowne Monthly Climate Breakdown: Twelve Month Weather Normals
| Mean temperature | Precipitation | Humidity | Wind speed | Daylight | |
|---|---|---|---|---|---|
| January | -3.8 °C-16.9° to 5.5° | 1.4 mm/day | 93.9% | 5.1 m/s | 8.4 hours |
| February | -2.2 °C-13.4° to 8.2° | 1.4 mm/day | 91.5% | 5 m/s | 9.8 hours |
| March | 1.9 °C-8.3° to 15.4° | 1.5 mm/day | 84.9% | 4.9 m/s | 11.6 hours |
| April | 7.9 °C-3.7° to 21.6° | 1.7 mm/day | 78.3% | 4.2 m/s | 13.6 hours |
| May | 13.3 °C1.9° to 25.3° | 2.6 mm/day | 76.1% | 3.9 m/s | 15.2 hours |
| June | 17 °C6.6° to 28.6° | 2.7 mm/day | 73.5% | 3.7 m/s | 16.1 hours |
| July | 19.3 °C8.9° to 31.2° | 3 mm/day | 69.9% | 3.6 m/s | 15.7 hours |
| August | 19 °C8.2° to 31.3° | 2.2 mm/day | 67.9% | 3.5 m/s | 14.2 hours |
| September | 13.8 °C2.9° to 26.9° | 2.2 mm/day | 73.8% | 3.9 m/s | 12.3 hours |
| October | 8 °C-3.2° to 22.1° | 1.7 mm/day | 83% | 4.2 m/s | 10.4 hours |
| November | 2.7 °C-7° to 14.6° | 1.6 mm/day | 91.2% | 4.3 m/s | 8.7 hours |
| December | -2.2 °C-13° to 6.5° | 1.4 mm/day | 93.9% | 4.8 m/s | 7.9 hours |
Comparing twelve long-term monthly normals across temperature, precipitation, humidity, and daylight duration
Sławice Duchowne Monthly Climate Highlights, Warmest, Coolest, and Wettest Averages
- Warmest month
- July19.3 °C
- Coolest month
- January-3.8 °C
- Wettest month
- July3 mm/day
- Driest month
- December1.4 mm/day
- Most humid month
- December93.9%
- Windiest month
- January5.1 m/s
- Longest daylight
- June16.1 hours
Interactive climate map
Compare National Park Climate Data Through an Interactive Global Map
Visit the MoriAtlas climate map to compare long-term monthly temperature and precipitation metrics across national parks. This visual interface helps you understand seasonal variations at specific protected area coordinates to deepen your knowledge of global park geography and environmental characteristics.
Examine monthly temperature, precipitation, humidity, wind, and daylight records across diverse protected landscapes
Compare Sławice Duchowne Climate Profiles With Other Protected Natural Areas Across Various Geographic Settings
Pstroszyce
- Annual mean
- 7.9 °C
- Warmest month
- July
- Wettest month
- July
Uniejów Parcele
- Annual mean
- 7.9 °C
- Warmest month
- July
- Wettest month
- July
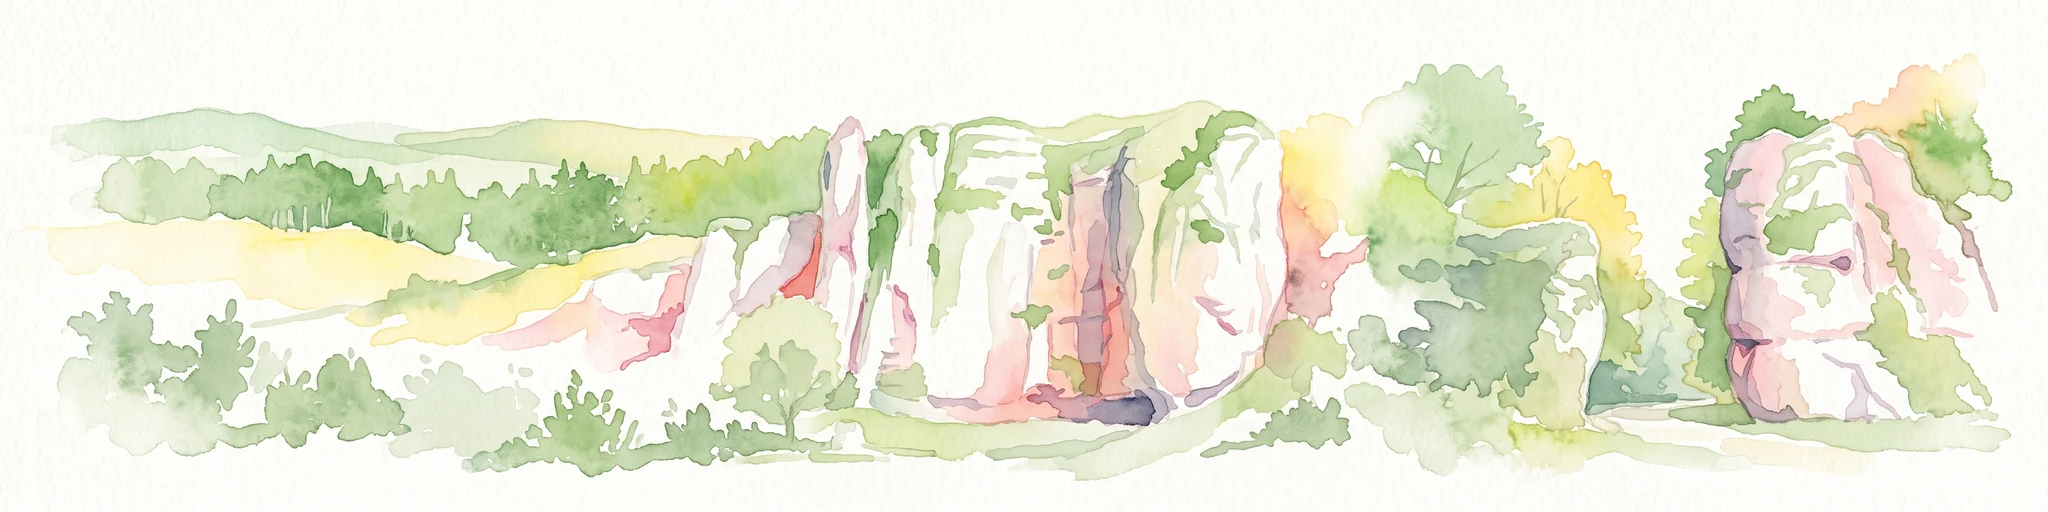
Ojcowski Park Narodowy
- Annual mean
- 8.3 °C
- Warmest month
- July
- Wettest month
- July
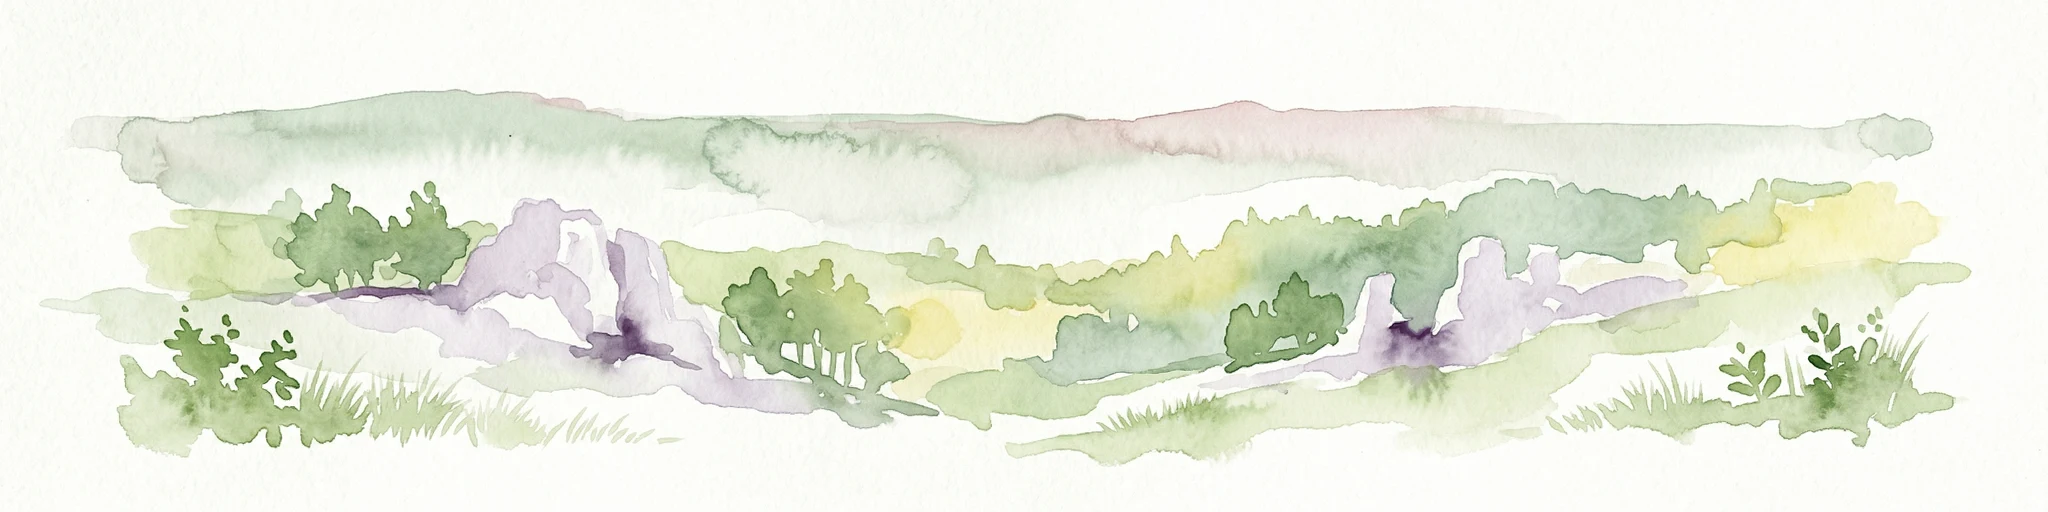
Ojców National Park
- Annual mean
- 8.3 °C
- Warmest month
- July
- Wettest month
- July
Rezerwat przyrody Dolina Kluczwody
- Annual mean
- 8.3 °C
- Warmest month
- July
- Wettest month
- July
Rezerwat przyrody Michałowiec
- Annual mean
- 8.1 °C
- Warmest month
- July
- Wettest month
- July
Deepen Your Understanding of the Sławice Duchowne Protected Landscape
Continue your geographic exploration of the Miechów Upland by investigating the ecological structure and botanical significance of Sławice Duchowne. MoriAtlas provides detailed context on the protected boundaries and natural features of this essential Lesser Poland reserve for those studying European dry-grassland habitats.