Climate profileJapan
Myōkō-Togakushi Renzan National Park
- Annual mean
- 11.2 °C
- Warmest month
- August
- Wettest month
- December

Long-term climatic averages representing annual patterns in temperature, wind, and daylight cycles
Detailed twelve-month climate analysis for Chūbu-Sangaku National Park, capturing the annual variability of mean, minimum, and maximum temperatures. These metrics represent long-term averages recorded from 1991 to 2020 at a specific representative coordinate. Users can examine consistent shifts in monthly precipitation rates, relative humidity, wind speed, and daylight duration to understand the climatological rhythm of this protected area.
Analysis of twelve-month average temperatures and daily precipitation rates for the Chūbu region
Compare average temperature bounds, daily precipitation rates, humidity, wind speed, and daylight hours across the annual cycle.
| Mean temperature | Precipitation | Humidity | Wind speed | Daylight | |
|---|---|---|---|---|---|
| January | 4.2 °C-0.7° to 11° | 7.1 mm/day | 81.2% | 5.9 m/s | 9.8 hours |
| February | 4 °C-1° to 11.8° | 5.1 mm/day | 78.3% | 5.6 m/s | 10.6 hours |
| March | 6.3 °C0.2° to 14.8° | 4.3 mm/day | 75.6% | 4.9 m/s | 11.8 hours |
| April | 10.9 °C3.2° to 19.9° | 3.7 mm/day | 74.5% | 4.2 m/s | 13 hours |
| May | 15.9 °C8.7° to 24.1° | 3.5 mm/day | 76% | 3.4 m/s | 14 hours |
| June | 20.1 °C14.5° to 26.6° | 5 mm/day | 80.6% | 2.9 m/s | 14.5 hours |
| July | 24.1 °C19.2° to 30.4° | 6.7 mm/day | 83.3% | 3.1 m/s | 14.2 hours |
| August | 26 °C21.5° to 31.4° | 5.4 mm/day | 80.1% | 3.2 m/s | 13.4 hours |
| September | 22.7 °C17.1° to 29.7° | 6.3 mm/day | 78.4% | 3.7 m/s | 12.2 hours |
| October | 17.6 °C11.2° to 24.9° | 5.2 mm/day | 75.8% | 4.2 m/s | 11 hours |
| November | 12.3 °C5.8° to 20° | 6.6 mm/day | 76.8% | 4.9 m/s | 10 hours |
| December | 7.2 °C1.1° to 15° | 8.1 mm/day | 80.6% | 5.8 m/s | 9.5 hours |
Comparing twelve long-term monthly averages for temperature, precipitation, wind, and daylight duration.
Interactive climate map
Visit the MoriAtlas climate map to compare long-term monthly temperature and precipitation metrics across national parks. This visual interface helps you understand seasonal variations at specific protected area coordinates to deepen your knowledge of global park geography and environmental characteristics.
Examine long-term temperature, precipitation, and atmospheric variations across diverse geographic settings
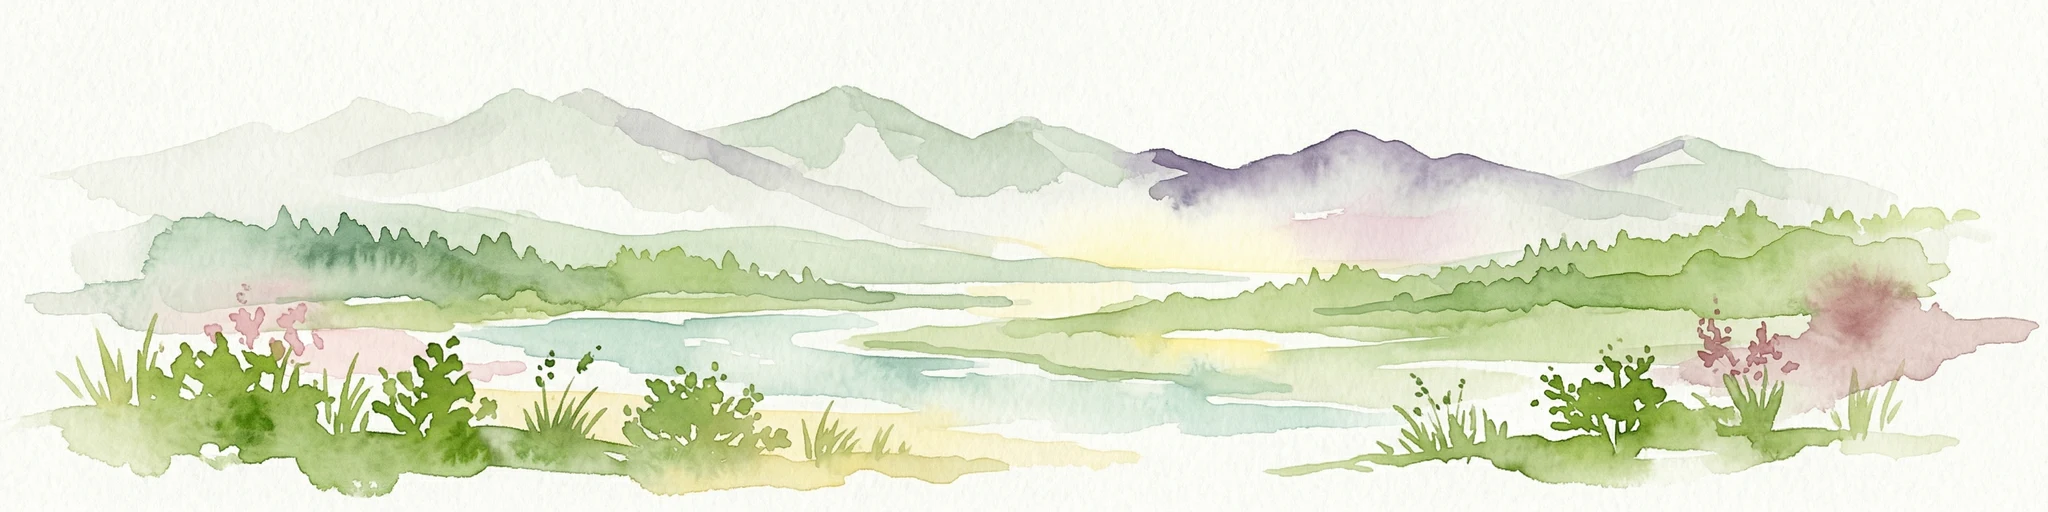
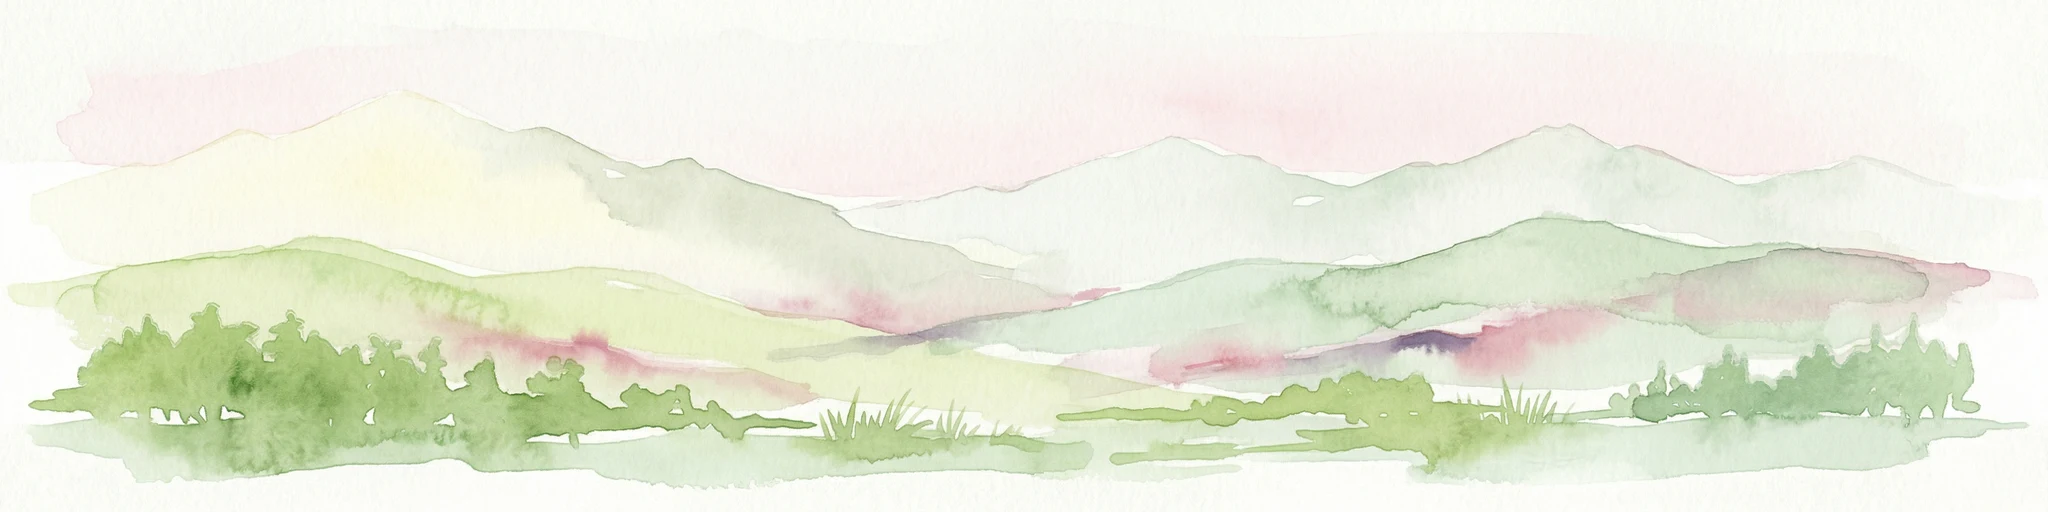
Delve deeper into the protected landscape of Chūbu-Sangaku National Park to understand its intricate alpine terrain, ridgelines, and river headwaters. Explore its context within the Northern Alps and appreciate the geographic significance of Japan's premier mountain wilderness through structured park data.