
Climate profileGermany
Plothener Teiche
- Annual mean
- 7.6 °C
- Warmest month
- July
- Wettest month
- July

Long-term temperature, precipitation, and wind averages at a representative elevation of 496 meters.
Analyze the twelve-month climate profile for Kobersfelsen, featuring standardized averages for temperature, rainfall, humidity, and wind speed. These statistics rely on the 1991 to 2020 climatology period derived from a single representative coordinate within the nature reserve. Monthly daylight hours and thermal variations illustrate the seasonal rhythm of this landscape without providing real-time forecasts or site-wide conditions.

Long-term monthly temperature cycles and average daily precipitation patterns for Kobersfelsen
Compare long-term monthly normals across temperature bounds, humidity, wind speed, and calculated daylight
| Mean temperature | Precipitation | Humidity | Wind speed | Daylight | |
|---|---|---|---|---|---|
| January | -2.4 °C-14.2° to 6.6° | 1.7 mm/day | 94.3% | 5.3 m/s | 8.3 hours |
| February | -1.5 °C-12.1° to 8.7° | 1.5 mm/day | 91.8% | 5 m/s | 9.8 hours |
| March | 2.5 °C-7° to 14.9° | 1.7 mm/day | 86.2% | 4.7 m/s | 11.6 hours |
| April | 7.2 °C-4° to 20.6° | 1.4 mm/day | 79.4% | 3.9 m/s | 13.6 hours |
| May | 11.9 °C0.2° to 24.3° | 2.1 mm/day | 77.1% | 3.7 m/s | 15.3 hours |
| June | 15.6 °C4.8° to 28.3° | 2.5 mm/day | 73.9% | 3.5 m/s | 16.2 hours |
| July | 17.8 °C7.6° to 30.3° | 2.8 mm/day | 69.9% | 3.5 m/s | 15.7 hours |
| August | 17.8 °C7° to 30.7° | 2.2 mm/day | 67.6% | 3.4 m/s | 14.2 hours |
| September | 13 °C2.8° to 25.7° | 2 mm/day | 74.9% | 3.7 m/s | 12.3 hours |
| October | 7.7 °C-2.3° to 20.7° | 1.7 mm/day | 85% | 4.2 m/s | 10.4 hours |
| November | 2.5 °C-6.1° to 13.1° | 1.9 mm/day | 92.2% | 4.4 m/s | 8.7 hours |
| December | -1.2 °C-11.3° to 7.3° | 1.9 mm/day | 94.4% | 5.1 m/s | 7.8 hours |
Examining long-term monthly normals for temperature, precipitation, humidity, wind, and daylight duration.
Interactive climate map
Visit the MoriAtlas climate map to compare long-term monthly temperature and precipitation metrics across national parks. This visual interface helps you understand seasonal variations at specific protected area coordinates to deepen your knowledge of global park geography and environmental characteristics.
Explore monthly temperature and precipitation rhythms across varied regional settings


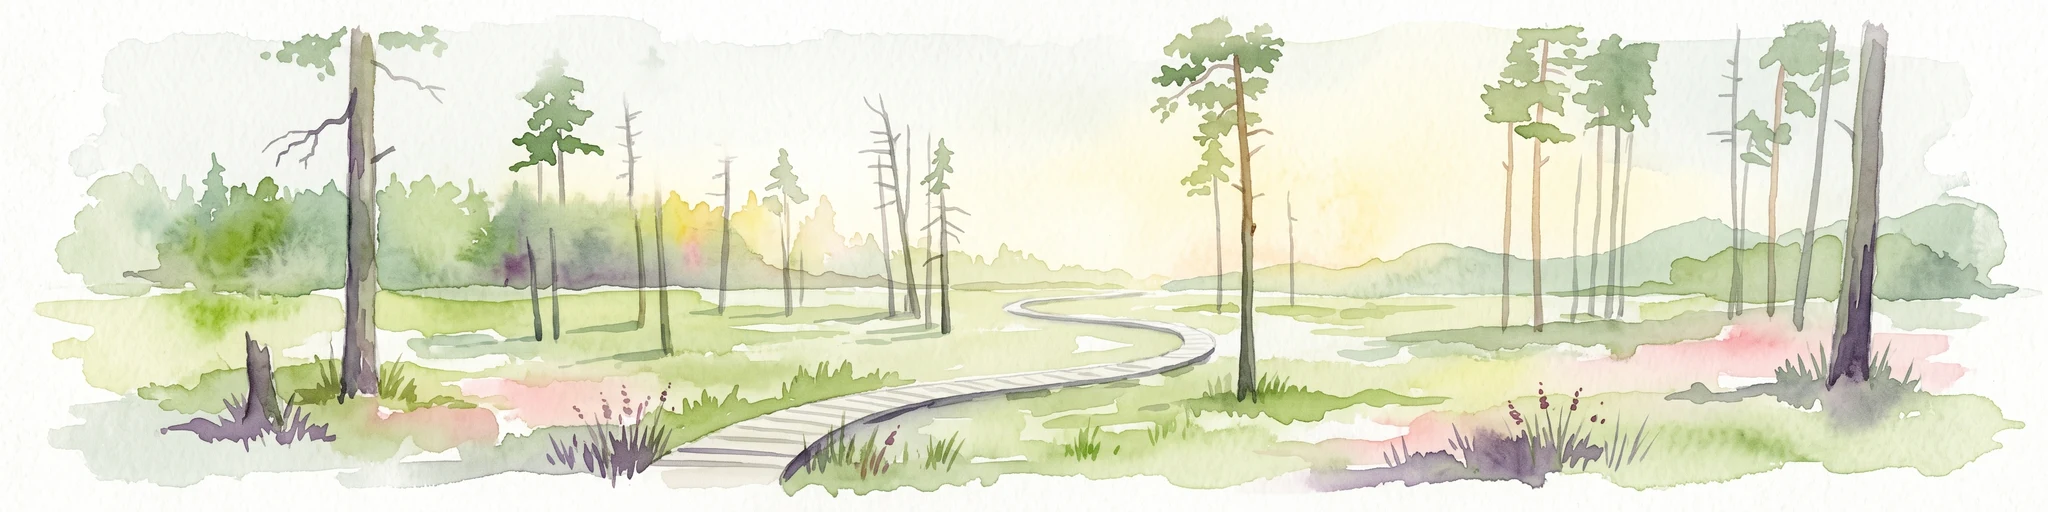


Gain a comprehensive understanding of the Kobersfelsen nature reserve through its mapped boundaries and topographic features. MoriAtlas provides a clear look at how this vertical cliff landscape connects to the wider ecological network of the Thuringian Slate Mountains, offering insights into one of Germany's most distinct rocky habitats.