
Climate profileCzechia
Rybník Motovidlo
- Annual mean
- 8 °C
- Warmest month
- July
- Wettest month
- July

Representative annual atmospheric patterns including precipitation and daylight across one coordinate.
The climate profile for Velký Karasín provides a structured overview of long-term monthly normals derived from the 1991 to 2020 climatology period. This data documents variations in average temperature, daily precipitation, relative humidity, wind speed, and daylight hours at a representative 530 meter elevation point. Readers can examine how these atmospheric measurements fluctuate throughout the calendar year to understand the regional climate context of this Czech Natural Monument.
Long-term monthly temperature cycles and average daily precipitation trends across the calendar year
Track long term monthly averages for temperature bounds, precipitation, wind, and daylight.
| Mean temperature | Precipitation | Humidity | Wind speed | Daylight | |
|---|---|---|---|---|---|
| January | -2.8 °C-14.5° to 7.4° | 1.3 mm/day | 92.5% | 4.7 m/s | 8.5 hours |
| February | -1.4 °C-12° to 10.1° | 1.1 mm/day | 88.7% | 4.6 m/s | 9.9 hours |
| March | 2.7 °C-7.4° to 16.7° | 1.5 mm/day | 82.5% | 4.5 m/s | 11.6 hours |
| April | 7.9 °C-3.7° to 21.7° | 1.4 mm/day | 76.3% | 3.8 m/s | 13.5 hours |
| May | 12.9 °C1.2° to 25.8° | 2.4 mm/day | 73.4% | 3.6 m/s | 15.1 hours |
| June | 16.8 °C5.5° to 29.9° | 3 mm/day | 70.5% | 3.3 m/s | 15.9 hours |
| July | 18.8 °C8.1° to 31.7° | 3 mm/day | 67.8% | 3.4 m/s | 15.5 hours |
| August | 18.6 °C7.5° to 31.5° | 2.7 mm/day | 67.8% | 3.1 m/s | 14.1 hours |
| September | 13.5 °C2.8° to 26.6° | 1.9 mm/day | 74.7% | 3.5 m/s | 12.3 hours |
| October | 8.1 °C-2.7° to 22.1° | 1.5 mm/day | 82.7% | 3.7 m/s | 10.5 hours |
| November | 2.6 °C-6.2° to 15.4° | 1.3 mm/day | 90.4% | 3.9 m/s | 8.9 hours |
| December | -1.5 °C-11.6° to 7.9° | 1.3 mm/day | 92.5% | 4.4 m/s | 8.1 hours |
See two months side by side and how much they differ. Both use the same 1991–2020 climate normals and NASA POWER data point as the table above, so they show typical conditions, not a forecast.
Comparative monthly averages for temperature, precipitation, wind, humidity, and daylight duration
Interactive climate map
Open the climate map to compare monthly temperature, precipitation, and other averages.
Explore monthly temperature normals and atmospheric patterns across diverse regional settings.




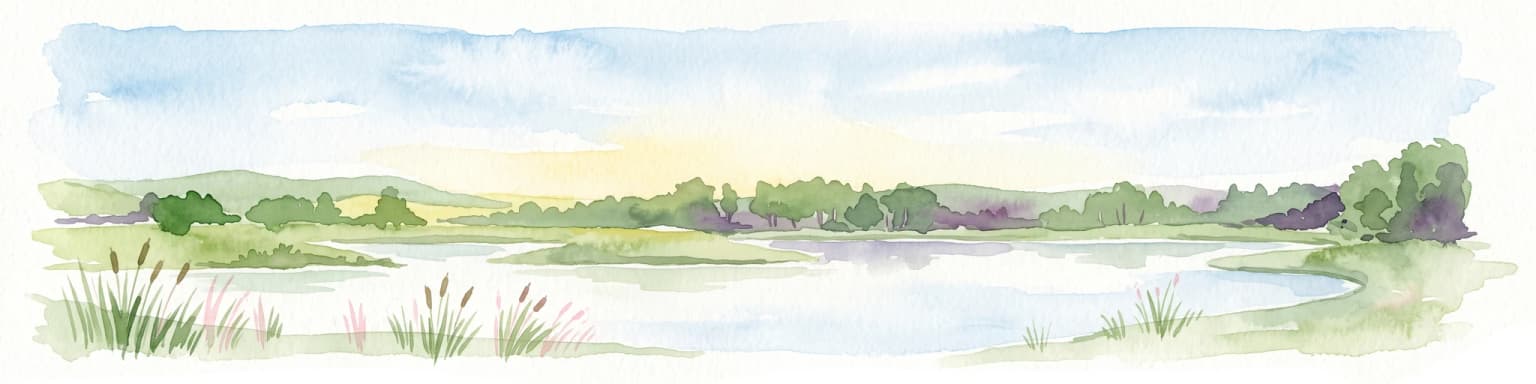

Examine the mapped extent and environmental context of Velký Karasín, a significant natural monument in the South Bohemian Region. This MoriAtlas destination provides insight into the ecological structure of Czech wetlands, focusing on the intersection of open water, reed beds, and surrounding meadows.