Mori Atlas logo
Park climate1991–2020 climate normals54 m source elevationNASA POWER

Twelve-month atmospheric patterns derived from representative geographic coordinates in Brandenburg

Monthly Climate Normals for Europäisches Vogelschutzgebiet Altfriedländer Teich- und Seengebiet

View long-term climatological measurements for Europäisches Vogelschutzgebiet Altfriedländer Teich- und Seengebiet based on data from 1991 to 2020. This profile tracks average monthly temperatures, daily precipitation rates, relative humidity, wind speed, and daylight hours at a single representative coordinate. These statistics provide a consistent basis for understanding the annual rhythm of the environment within the protected nature reserve, distinct from daily weather forecasts or current meteorological events.

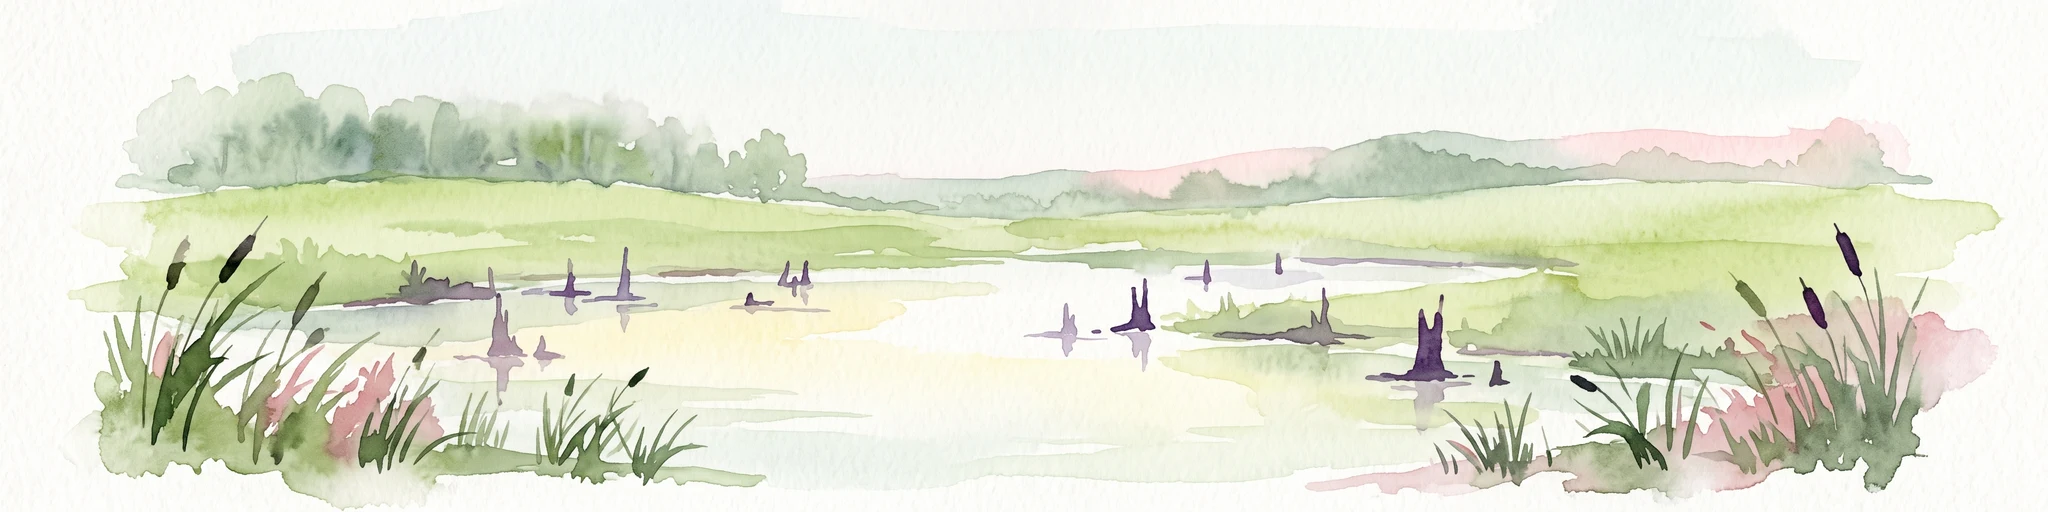
A digital illustration showing a wetlands area with winding channels of water, reeds, and low-lying vegetation. Numerous small white birds are present, some resting on small islands and others in flight. In the background, there are gentle hills and trees under a soft, light-colored sky.
Annual climate pattern

A pronounced cold-to-warm cycle with daily precipitation highest in July

Altfriedländer ponds and lakes annual temperature and rainfall pattern

The Altfriedländer pond and lake area's 1991–2020 mean temperature climbs from -1.1°C in January to 20.3°C in July, while average minimum and maximum values trace the annual thermal swing. At one point near 54 metres, daily precipitation averages 1.08 mm in April to 2.47 mm in July, summarizing climate normals rather than observed extremes or uniform conditions across the protected area.
Mean temperatureAverage minimum–maximum rangePrecipitation
Temperature (°C)PrecipitationUp to 2.5 mm/day-20°-10°0°10°20°30°40°-1°0°3°9°14°18°20°20°15°9°4°0°01231.61.41.51.11.71.92.51.91.61.41.51.6JanFebMarAprMayJunJulAugSepOctNovDec
Annual mean
9.3 °C
Warmest month
July
Coolest month
January
Wettest month
July
Twelve-month climate

Complete twelve-month comparison of temperature bounds, precipitation rates, humidity, wind speed, and daylight hours

Europäisches Vogelschutzgebiet Altfriedländer Teich- und Seengebiet Weather by Month and Climate Normals

Systematic evaluation of monthly temperature bounds, average daily precipitation rates, and relative humidity across the calendar year reveals long-term climatological baselines. Analyzing wind speed alongside calculated daylight hours at a representative coordinate provides structured insight into environmental conditions without relying on seasonal generalizations.
Mean temperaturePrecipitationHumidityWind speedDaylight
January-1.1 °C-12.6° to 8.2°1.6 mm/day93.4%5.3 m/s8 hours
February0.1 °C-9.4° to 10.2°1.4 mm/day90.4%5.1 m/s9.6 hours
March3.5 °C-6.1° to 16.4°1.5 mm/day84.6%4.9 m/s11.6 hours
April8.9 °C-2.4° to 22.6°1.1 mm/day76.9%4.3 m/s13.7 hours
May13.9 °C2.1° to 27.3°1.7 mm/day72.1%4.1 m/s15.5 hours
June17.9 °C7.2° to 31.3°1.9 mm/day66.1%4.2 m/s16.5 hours
July20.3 °C10° to 32.9°2.5 mm/day64.5%4.1 m/s16.1 hours
August19.9 °C9.5° to 33°1.9 mm/day64.6%3.9 m/s14.4 hours
September15 °C4.9° to 27.6°1.6 mm/day72%4.2 m/s12.4 hours
October9.3 °C-0.9° to 21.8°1.4 mm/day81.8%4.5 m/s10.2 hours
November3.8 °C-4.7° to 14°1.5 mm/day91.6%4.6 m/s8.4 hours
December0.1 °C-9.1° to 8.9°1.6 mm/day94%5.1 m/s7.5 hours
Calculated climate highlights

Comparative analysis of long-term temperature, precipitation, humidity, wind, and daylight normals across twelve calendar months

Calculated Monthly Climate Highlights and Extremes for Europäisches Vogelschutzgebiet Altfriedländer Teich- und Seengebiet

Comparative monthly normals summarize long-term temperature, humidity, wind, and precipitation patterns derived from stored coordinates within Europäisches Vogelschutzgebiet Altfriedländer Teich- und Seengebiet. Values indicate calculated climatological averages rather than observed weather extremes or uniform regional conditions across the entire protected landscape.
Warmest month
July20.3 °C
Coolest month
January-1.1 °C
Wettest month
July2.5 mm/day
Driest month
April1.1 mm/day
Most humid month
December94%
Windiest month
January5.3 m/s
Longest daylight
June16.5 hours

Interactive climate map

Compare National Park Climate Data Through an Interactive Global Map

Visit the MoriAtlas climate map to compare long-term monthly temperature and precipitation metrics across national parks. This visual interface helps you understand seasonal variations at specific protected area coordinates to deepen your knowledge of global park geography and environmental characteristics.

Global National Park Climate Map
Other park climates

Examine monthly weather normals and atmospheric variations across diverse regional landscapes.

Comparing Europäisches Vogelschutzgebiet Altfriedländer Teich- und Seengebiet Climate Profiles With Other Protected Areas

Standardized monthly climate normals allow researchers to analyze long-term temperature, precipitation, humidity, wind, and daylight patterns across distinct protected landscapes. Comparing these historical meteorological metrics reveals diverse regional atmospheric conditions across multiple conservation areas.
MoriAtlas Explorer

Examine the Protected Landscapes of Europäisches Vogelschutzgebiet Altfriedländer Teich- und Seengebiet

Continue your geographic discovery by exploring the mapped wetlands and seasonal mudflat dynamics of this significant German reserve. MoriAtlas provides detailed insight into how this pond-rich terrain functions as a critical sanctuary within the wider Brandenburg ecosystem.