
Twelve month atmospheric patterns based on NASA POWER climatology for a representative coordinate
Přírodní park Džbány-Žebrák Monthly Climate Normals, Temperature and Precipitation Profiles
Detailed monthly climate normals for Přírodní park Džbány-Žebrák provide a standardized long term view of temperature, precipitation, humidity, wind speed, and daylight hours. These records reflect the 1991 to 2020 climatology period derived from a specific representative coordinate at 486 meters elevation. By tracking these consistent monthly patterns, gain a deeper understanding of the atmospheric conditions defining this protected landscape throughout the calendar year.
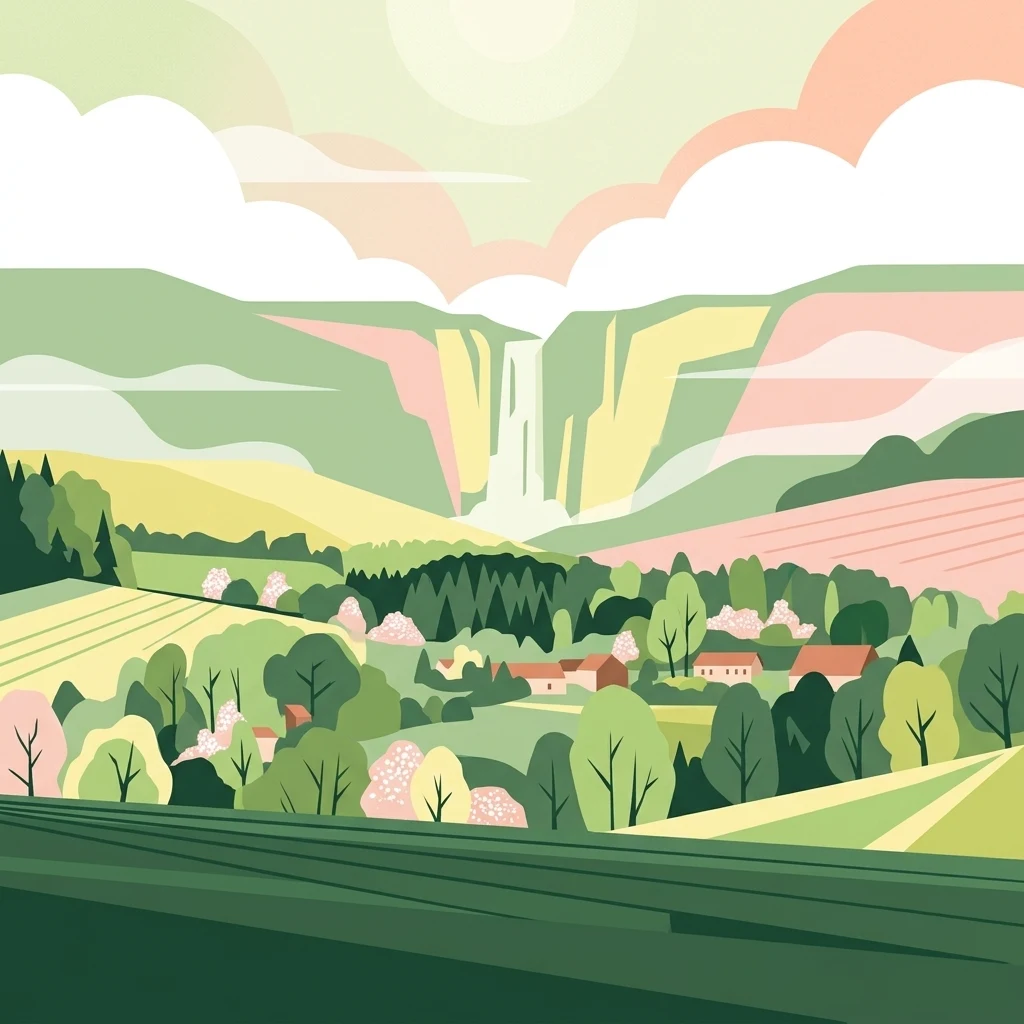
Long-term monthly temperature averages and daily precipitation rates across the calendar year
Přírodní park Džbány-Žebrák Annual Climate Normals and Monthly Temperature Patterns
- Annual mean
- 8 °C
- Warmest month
- July
- Coolest month
- January
- Wettest month
- June
Examine long-term monthly normals across temperature bounds, precipitation rates, and daylight hours.
Přírodní park Džbány-Žebrák Weather by Month: Complete Twelve-Month Climate Comparison
| Mean temperature | Precipitation | Humidity | Wind speed | Daylight | |
|---|---|---|---|---|---|
| January | -2.7 °C-14.6° to 7.1° | 1.3 mm/day | 93.1% | 5.1 m/s | 8.4 hours |
| February | -1.4 °C-12° to 9.6° | 1.2 mm/day | 89.5% | 5 m/s | 9.8 hours |
| March | 2.7 °C-7.4° to 16.2° | 1.5 mm/day | 83.5% | 4.9 m/s | 11.6 hours |
| April | 7.8 °C-3.7° to 21.4° | 1.3 mm/day | 77.2% | 4.1 m/s | 13.5 hours |
| May | 12.8 °C1.2° to 25.3° | 2.2 mm/day | 74.1% | 4 m/s | 15.2 hours |
| June | 16.8 °C5.7° to 29.8° | 2.8 mm/day | 69.9% | 3.7 m/s | 16 hours |
| July | 18.9 °C8.3° to 31.8° | 2.7 mm/day | 66.1% | 3.7 m/s | 15.6 hours |
| August | 18.7 °C7.8° to 31.6° | 2.6 mm/day | 65.7% | 3.4 m/s | 14.2 hours |
| September | 13.6 °C2.8° to 26.7° | 1.8 mm/day | 73.1% | 3.9 m/s | 12.3 hours |
| October | 8.1 °C-2.6° to 21.9° | 1.5 mm/day | 82.5% | 4.2 m/s | 10.4 hours |
| November | 2.6 °C-6.1° to 14.5° | 1.4 mm/day | 91% | 4.3 m/s | 8.8 hours |
| December | -1.5 °C-11.7° to 7.6° | 1.4 mm/day | 93.3% | 4.8 m/s | 8 hours |
Comparative monthly averages for temperature, precipitation, humidity, wind, and daylight duration
Calculated Monthly Climate Highlights and Extremes for Přírodní park Džbány-Žebrák
- Warmest month
- July18.9 °C
- Coolest month
- January-2.7 °C
- Wettest month
- June2.8 mm/day
- Driest month
- February1.2 mm/day
- Most humid month
- December93.3%
- Windiest month
- January5.1 m/s
- Longest daylight
- June16 hours
Interactive climate map
Compare National Park Climate Data Through an Interactive Global Map
Visit the MoriAtlas climate map to compare long-term monthly temperature and precipitation metrics across national parks. This visual interface helps you understand seasonal variations at specific protected area coordinates to deepen your knowledge of global park geography and environmental characteristics.
Analyze long-term monthly temperature, precipitation, wind, and daylight variations across diverse regional park settings.
Beyond Přírodní park Džbány-Žebrák: Compare Monthly Climate Profiles Across Protected Landscapes
Rybník Louňov
- Annual mean
- 7.8 °C
- Warmest month
- July
- Wettest month
- July
Vlašimská Blanice
- Annual mean
- 7.8 °C
- Warmest month
- July
- Wettest month
- July
Na ostrově
- Annual mean
- 7.8 °C
- Warmest month
- July
- Wettest month
- July
Vápenické jezero
- Annual mean
- 8 °C
- Warmest month
- July
- Wettest month
- June
Hornopožárský les Nature Park
- Annual mean
- 8.6 °C
- Warmest month
- July
- Wettest month
- June
Vlčí rokle
- Annual mean
- 8.6 °C
- Warmest month
- July
- Wettest month
- June
Na Stříbrné
- Annual mean
- 8.6 °C
- Warmest month
- July
- Wettest month
- July
Deepen Your Understanding of Přírodní park Džbány-Žebrák and Its Protected Landscape
Examine the intricate natural features and regional topography of Přírodní park Džbány-Žebrák to grasp how this site fits into the broader conservation framework of the Benešov District. MoriAtlas provides a clear view of its summit-to-valley transitions, wetland systems, and forest-meadow mosaics for detailed geographic study.