
Climate profileUnited States of America
Los Padres National Forest
- Annual mean
- 16.2 °C
- Warmest month
- August
- Wettest month
- February

Detailed climatology based on NASA POWER measurements for a representative park coordinate
Review the multi-year atmospheric patterns of Garcia Wilderness in San Luis Obispo County through established climate normals. This dataset tracks monthly averages for minimum, mean, and maximum temperatures, daily precipitation rates, relative humidity, wind speed, and daylight duration from 1991 to 2020. Data reflects conditions at one specific representative point to provide a consistent basis for understanding the annual rhythm of this wildlife reserve.
Long-term monthly averages tracking thermal range and daily precipitation patterns across the year
Analyze average temperature bounds, daily precipitation rates, humidity, wind speed, and calculated daylight across the calendar year.
| Mean temperature | Precipitation | Humidity | Wind speed | Daylight | |
|---|---|---|---|---|---|
| January | 8.9 °C-1.3° to 22.5° | 2.7 mm/day | 69.5% | 3.4 m/s | 9.9 hours |
| February | 9.3 °C-0.8° to 22.8° | 2.9 mm/day | 72.4% | 3.5 m/s | 10.7 hours |
| March | 10.9 °C0.4° to 25.3° | 2.1 mm/day | 71.9% | 3.5 m/s | 11.8 hours |
| April | 12.9 °C1.8° to 29.4° | 0.8 mm/day | 65.4% | 3.8 m/s | 12.9 hours |
| May | 16.8 °C5° to 33.5° | 0.4 mm/day | 56% | 3.5 m/s | 13.9 hours |
| June | 21.3 °C7.4° to 37.9° | 0.1 mm/day | 43% | 3.3 m/s | 14.3 hours |
| July | 24.8 °C11.7° to 40° | 0.1 mm/day | 36.8% | 2.9 m/s | 14.1 hours |
| August | 24.6 °C11.8° to 39.8° | 0 mm/day | 36.1% | 2.7 m/s | 13.3 hours |
| September | 22.3 °C8.9° to 38.2° | 0.1 mm/day | 40.5% | 2.7 m/s | 12.2 hours |
| October | 17.5 °C5.6° to 34.1° | 0.6 mm/day | 47.5% | 3 m/s | 11.1 hours |
| November | 12.2 °C1.1° to 28.3° | 0.9 mm/day | 58.4% | 3.2 m/s | 10.1 hours |
| December | 8.6 °C-1.8° to 22.7° | 1.9 mm/day | 66.1% | 3.4 m/s | 9.7 hours |
See two months side by side and how much they differ. Both use the same 1991–2020 climate normals and NASA POWER data point as the table above, so they show typical conditions, not a forecast.
Warmest, coolest, wettest, and driest long-term monthly averages across the protected landscape
Interactive climate map
Open the climate map to compare monthly temperature, precipitation, and other averages.
Explore monthly temperature and precipitation normals across diverse geographic settings
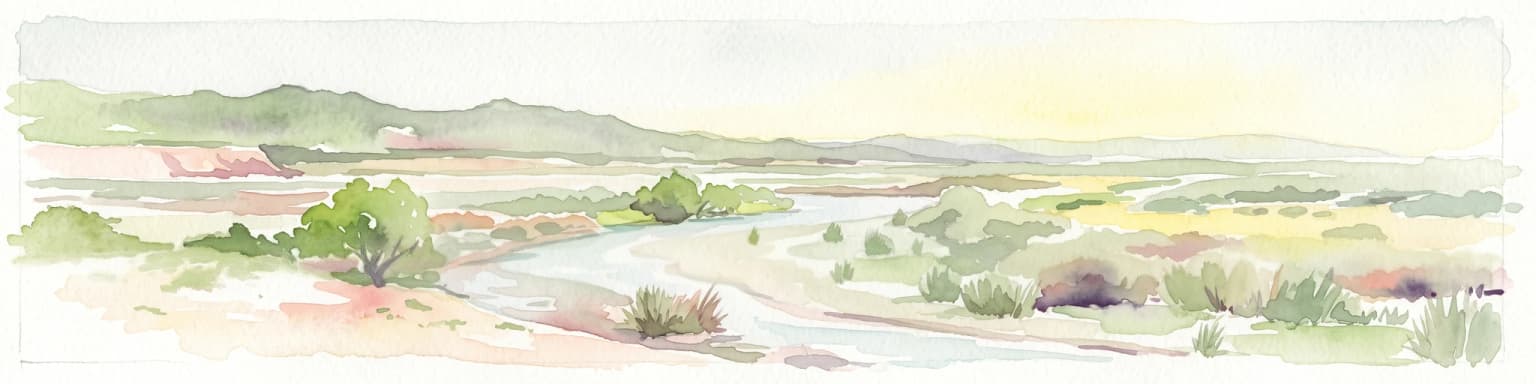





Deepen your understanding of Garcia Wilderness through a detailed look at its ridge-based topography and protected ecosystems within San Luis Obispo County. MoriAtlas provides the structured data needed to interpret this unique segment of the Santa Lucia Range and its regional importance to coastal conservation.