Climate profileUnited States of America
Black Canyon of the Gunnison National Park
- Annual mean
- 4.7 °C
- Warmest month
- July
- Wettest month
- August

Review long-term trends in temperature, precipitation, humidity, and daylight for this representative elevation.
Detailed monthly climate profiles for Grand Mesa National Forest provide a standardized look at meteorological patterns over the 1991 to 2020 period. Data for this representative coordinate include average minimum and maximum temperatures, daily precipitation rates, relative humidity, wind speed, and daylight hours. These figures offer a clear view of annual variability without reflecting live forecasts or specific visitor conditions.
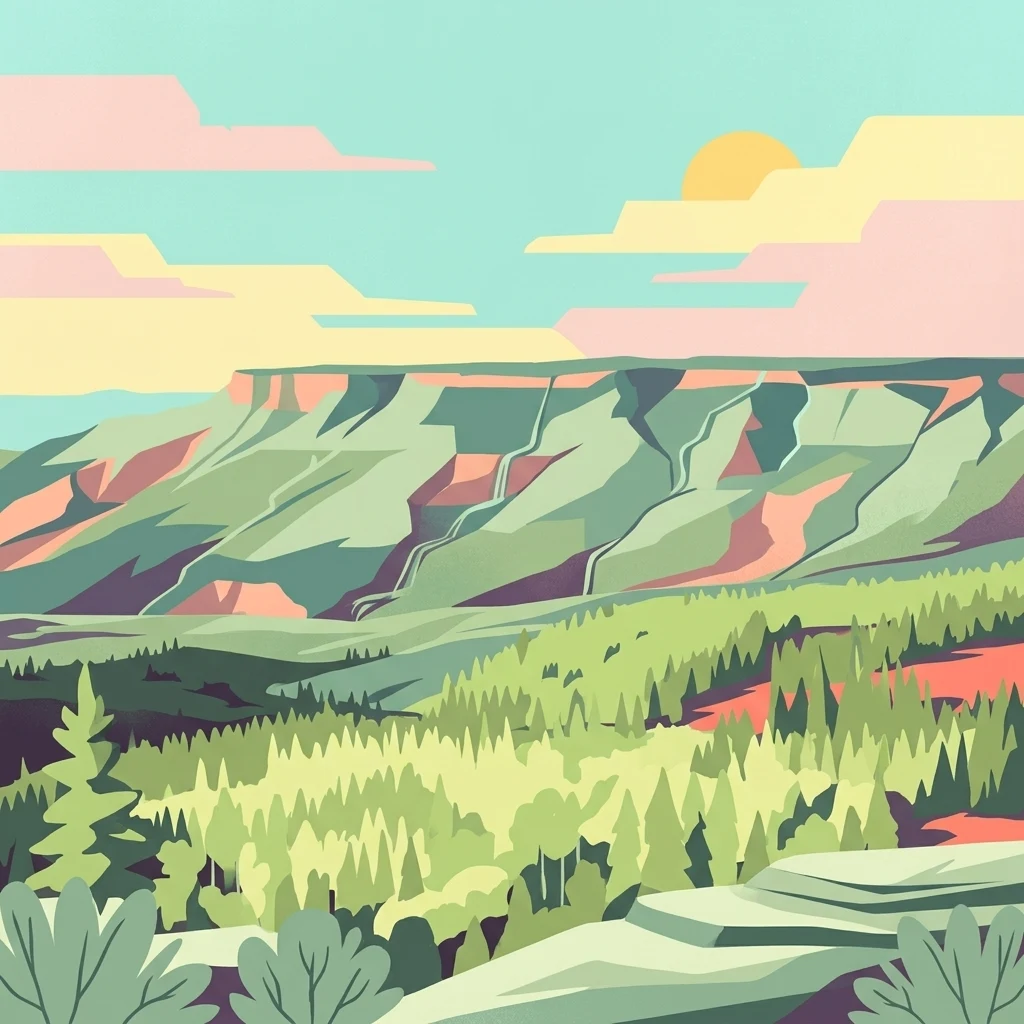
Long term average monthly temperature ranges and daily precipitation rates across twelve months
Analyze average temperature bounds, precipitation rates, humidity, wind, and calculated daylight across the calendar year.
| Mean temperature | Precipitation | Humidity | Wind speed | Daylight | |
|---|---|---|---|---|---|
| January | -4.8 °C-18.6° to 7.4° | 1.1 mm/day | 76% | 2.5 m/s | 9.6 hours |
| February | -2.7 °C-16.4° to 10° | 1.1 mm/day | 71% | 2.9 m/s | 10.5 hours |
| March | 1.7 °C-11.4° to 16.3° | 1.2 mm/day | 61.6% | 3.1 m/s | 11.7 hours |
| April | 5.5 °C-6.9° to 21° | 1.3 mm/day | 55.7% | 3.4 m/s | 13 hours |
| May | 11.4 °C-3.4° to 26.8° | 1.2 mm/day | 48.8% | 3.2 m/s | 14.1 hours |
| June | 18 °C2.3° to 32.2° | 0.6 mm/day | 36.5% | 3.3 m/s | 14.7 hours |
| July | 21.6 °C8.3° to 34.4° | 1.1 mm/day | 39.6% | 2.7 m/s | 14.4 hours |
| August | 20 °C7.8° to 32.6° | 1.2 mm/day | 44.6% | 2.5 m/s | 13.5 hours |
| September | 15 °C-0.1° to 29.6° | 1.4 mm/day | 45.2% | 2.8 m/s | 12.2 hours |
| October | 7.4 °C-6.8° to 23.4° | 1.2 mm/day | 51.4% | 2.8 m/s | 10.9 hours |
| November | 0.7 °C-12° to 15.7° | 1 mm/day | 61.1% | 2.6 m/s | 9.8 hours |
| December | -4.5 °C-18.1° to 8.4° | 1.1 mm/day | 72.8% | 2.5 m/s | 9.3 hours |
Comparative monthly averages for temperature, precipitation, wind, humidity, and daylight duration
Interactive climate map
Visit the MoriAtlas climate map to compare long-term monthly temperature and precipitation metrics across national parks. This visual interface helps you understand seasonal variations at specific protected area coordinates to deepen your knowledge of global park geography and environmental characteristics.
Examine monthly temperature, precipitation, and daylight rhythms across diverse geographic settings.

Navigate into the detailed geographic profile of Grand Mesa National Forest, where ancient volcanic basalt caps and montane reservoirs create a distinctive Western Slope environment. MoriAtlas provides a clear view of the park boundaries, landscape character, and regional setting of one of the oldest federal forest reserves in the Rocky Mountain region.