Climate profileUnited States of America
Mount Sneffels Wilderness
- Annual mean
- 4.5 °C
- Warmest month
- July
- Wettest month
- August

Long-term atmospheric averages derived from NASA POWER measurements at a representative elevation.
Detailed monthly climate profiles for Lizard Head Wilderness based on representative point data from 1991 to 2020. This documentation clarifies annual patterns for temperature, daily precipitation rates, relative humidity, wind speed, and daylight hours. These averages provide a high-resolution view of the local atmospheric rhythm, distinct from real-time weather forecasts or current conditions.

Long-term monthly thermal range and average daily precipitation across twelve recorded months
Track average temperature bounds, precipitation rates, humidity, wind, and daylight across the calendar year.
| Mean temperature | Precipitation | Humidity | Wind speed | Daylight | |
|---|---|---|---|---|---|
| January | -7 °C-20.9° to 4.7° | 1.7 mm/day | 78.3% | 2.6 m/s | 9.7 hours |
| February | -5.9 °C-20.3° to 5.5° | 1.8 mm/day | 78.3% | 2.9 m/s | 10.6 hours |
| March | -1.5 °C-16.6° to 12.4° | 1.6 mm/day | 68% | 3.1 m/s | 11.8 hours |
| April | 2.6 °C-10.5° to 16.9° | 1.5 mm/day | 59.6% | 3.4 m/s | 13 hours |
| May | 8.1 °C-5.7° to 22.3° | 1.4 mm/day | 52.3% | 3.2 m/s | 14.1 hours |
| June | 14.3 °C-0.4° to 27.6° | 0.7 mm/day | 40.7% | 3.1 m/s | 14.6 hours |
| July | 17.5 °C6° to 29.7° | 1.6 mm/day | 48% | 2.4 m/s | 14.3 hours |
| August | 16.2 °C5.9° to 27.8° | 1.8 mm/day | 52.2% | 2.3 m/s | 13.4 hours |
| September | 12 °C-1.7° to 25.5° | 1.8 mm/day | 50% | 2.7 m/s | 12.2 hours |
| October | 5.2 °C-9° to 19.9° | 1.5 mm/day | 53.9% | 2.8 m/s | 11 hours |
| November | -1.4 °C-16.8° to 12.8° | 1.5 mm/day | 63.4% | 2.7 m/s | 9.9 hours |
| December | -6.4 °C-21.3° to 6.2° | 1.5 mm/day | 74.7% | 2.7 m/s | 9.4 hours |
See two months side by side and how much they differ. Both use the same 1991–2020 climate normals and NASA POWER data point as the table above, so they show typical conditions, not a forecast.
Comparative monthly averages for temperature, precipitation, wind, and daylight duration.
Interactive climate map
Open the climate map to compare monthly temperature, precipitation, and other averages.
Monthly temperature, precipitation, and daylight patterns across distinct protected landscapes


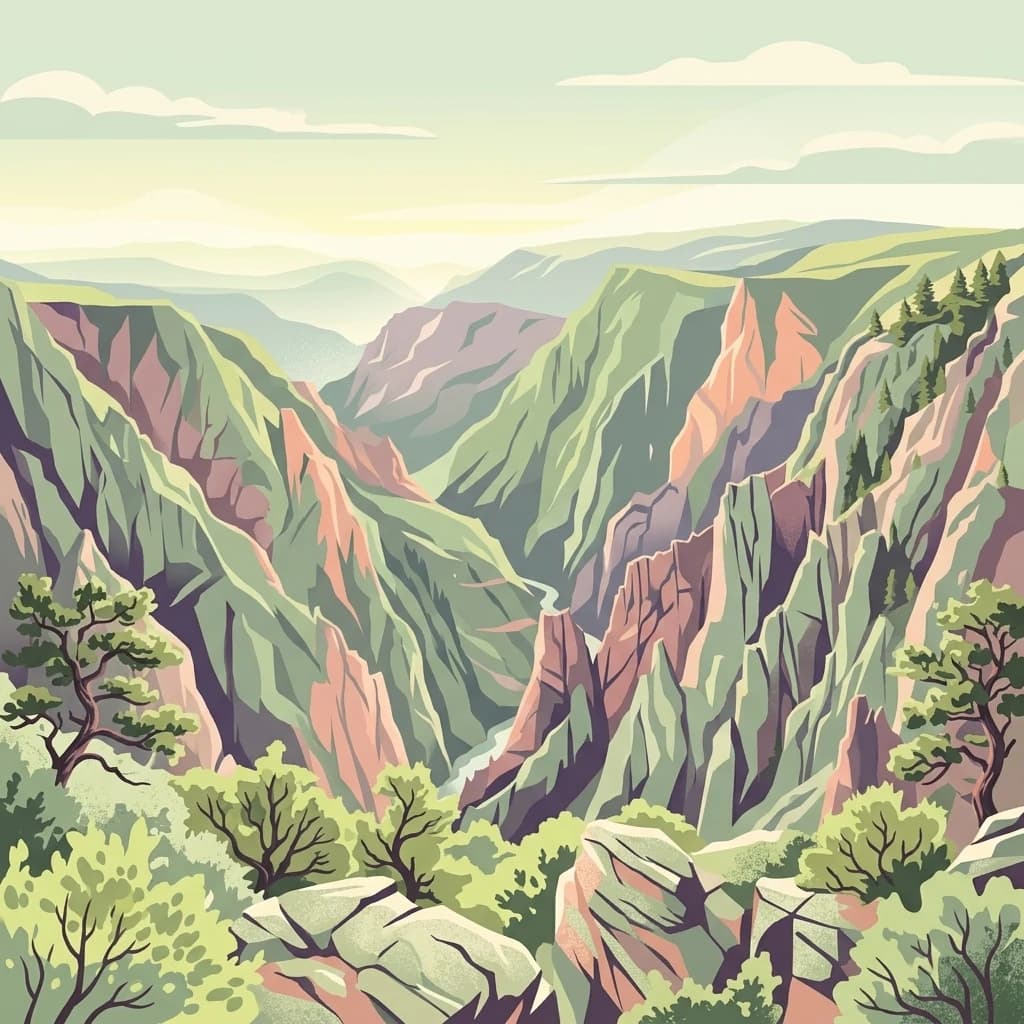


Deepen your understanding of this high-elevation sanctuary by exploring the mapped terrain and geological features of Lizard Head Wilderness. Use the MoriAtlas dataset to trace the ridgelines, peaks, and watersheds that define this protected expanse in the San Juan Mountains of Colorado.