
Climate profileGermany
Hartwald mit Umgebung
- Annual mean
- 9.4 °C
- Warmest month
- July
- Wettest month
- July

Twelve month analysis of temperature, precipitation, wind, and daylight at the representative park coordinate
Climate data represents long term monthly averages for Neckartal zwischen den Neckarbrücken von Hochberg und Neckarweihingen mit Randgebieten, insbesondere Uhlberg, Lochholz und Beuzlen based on the 1991 to 2020 NASA POWER dataset. Measurements provide a structured view of atmospheric conditions at a single representative point. Annual patterns include mean temperature, average minimum and maximum temperature, precipitation rates, relative humidity, wind speed, and daylight duration throughout the year.
A broad January-to-July temperature swing with precipitation highest in July
Compare long-term temperature, precipitation, humidity, airflow, and daylight
| Mean temperature | Precipitation | Humidity | Wind speed | Daylight | |
|---|---|---|---|---|---|
| January | -0.2 °C-10.7° to 9.8° | 1.9 mm/day | 92% | 4.7 m/s | 8.5 hours |
| February | 0.7 °C-9.2° to 12.1° | 1.7 mm/day | 88.7% | 4.6 m/s | 9.9 hours |
| March | 4.6 °C-5.6° to 17.4° | 1.8 mm/day | 83.2% | 4.5 m/s | 11.6 hours |
| April | 8.9 °C-2.9° to 22.1° | 1.6 mm/day | 77.5% | 3.8 m/s | 13.5 hours |
| May | 13.4 °C2° to 26.1° | 2.6 mm/day | 75.8% | 3.6 m/s | 15.1 hours |
| June | 17.3 °C6.4° to 30.3° | 2.5 mm/day | 71.7% | 3.4 m/s | 15.9 hours |
| July | 19.6 °C8.9° to 32.7° | 2.7 mm/day | 66.8% | 3.5 m/s | 15.5 hours |
| August | 19.5 °C8.3° to 32.7° | 2.3 mm/day | 66% | 3.3 m/s | 14.1 hours |
| September | 14.8 °C4.3° to 27.9° | 2 mm/day | 72.2% | 3.5 m/s | 12.3 hours |
| October | 9.6 °C-1° to 22.8° | 2.1 mm/day | 82.4% | 3.8 m/s | 10.5 hours |
| November | 4.2 °C-4.6° to 16° | 2.1 mm/day | 90% | 3.9 m/s | 8.9 hours |
| December | 0.7 °C-9.5° to 10.1° | 2.2 mm/day | 92.5% | 4.5 m/s | 8.1 hours |
Monthly-average leaders across temperature, precipitation, humidity, wind, and light
Interactive climate map
Visit the MoriAtlas climate map to compare long-term monthly temperature and precipitation metrics across national parks. This visual interface helps you understand seasonal variations at specific protected area coordinates to deepen your knowledge of global park geography and environmental characteristics.
Compare standardized monthly patterns across different protected terrain


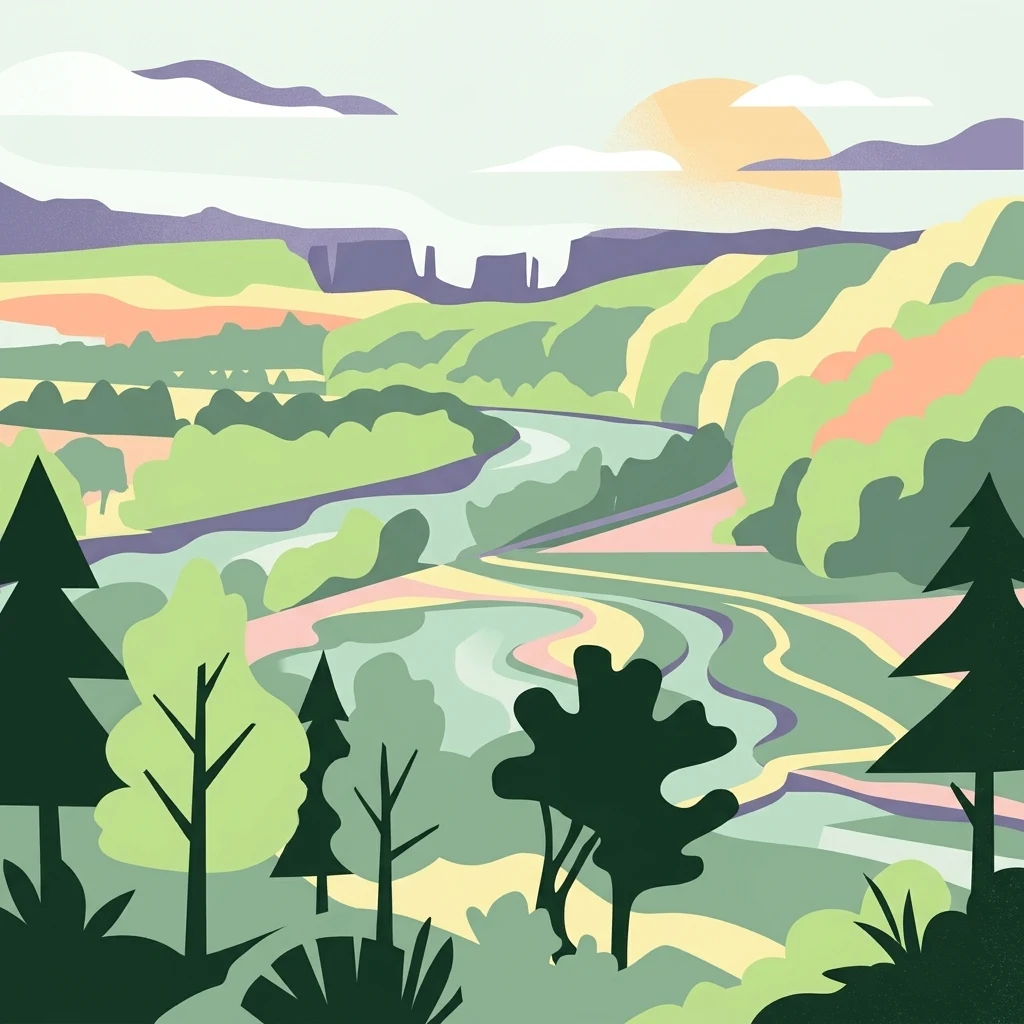
Examine the mapped boundaries and natural features of this designated protected landscape in Germany. MoriAtlas provides a clear view of the river meanders, terraced slopes, and valley terrain that comprise the Neckartal protected area within the state of Baden-Württemberg.